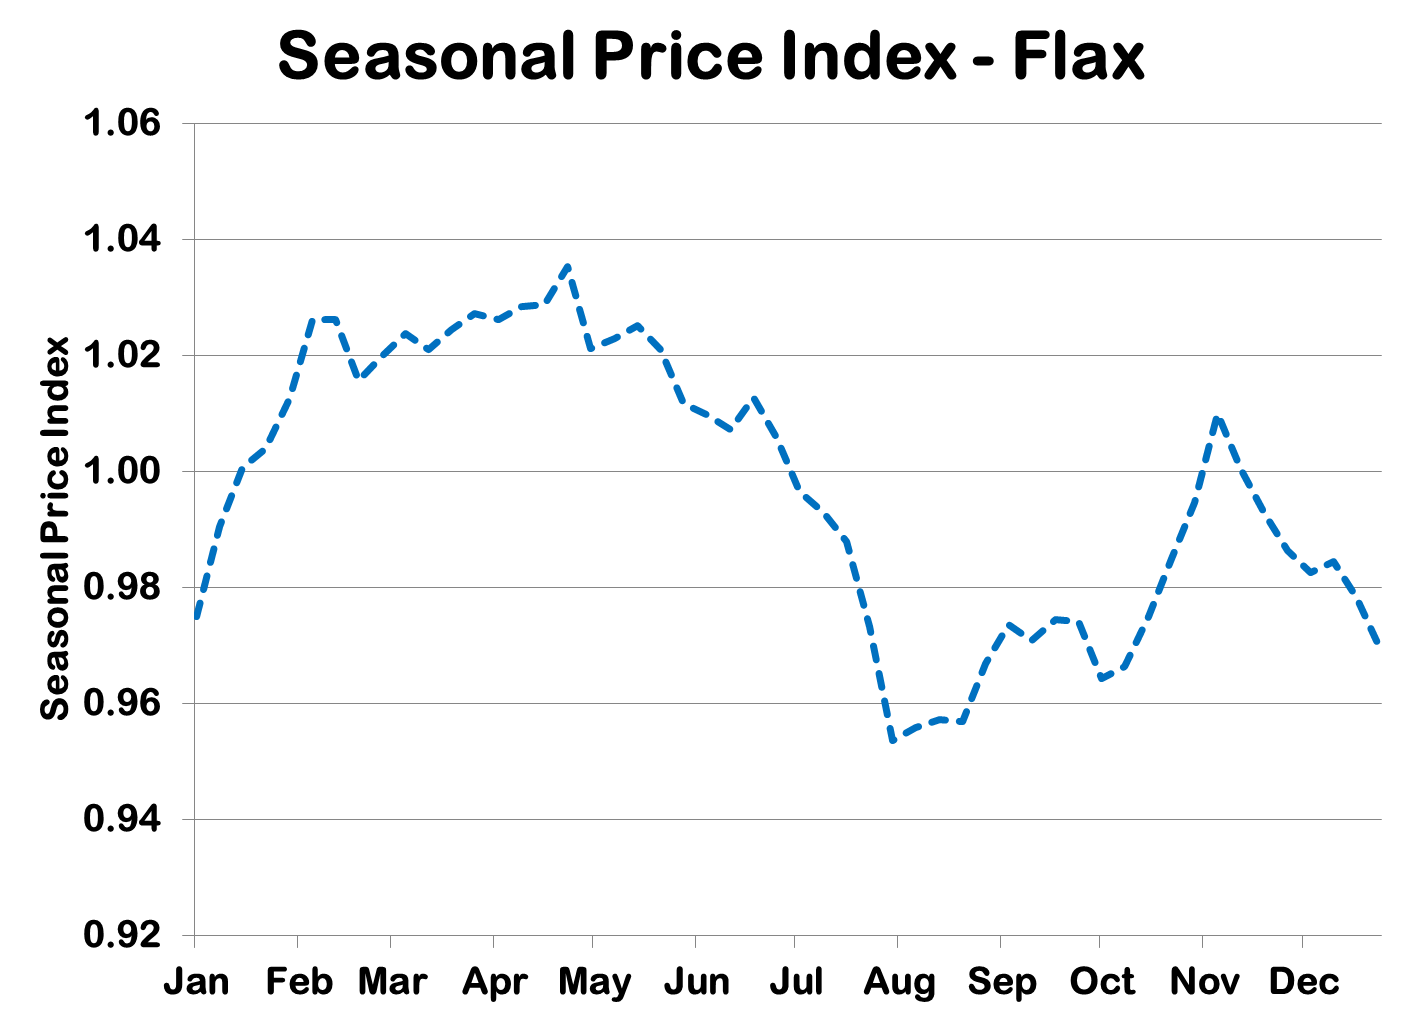
Flax Chart of the Week
The seasonal price index shows the average pattern of price movement over the year. For flax, the high of the year tends to occur in late April once European demand has been satisfied and farmers start to clean out old-crop supplies. Bids in western Canada and the US are starting to show signs of moving lower, which would fit with this seasonal pattern.


